
Currently Browsing
October, 2013
Supporting Common Core Math Standards with Images
- 21 October //
- Posted in How To //
- Tags : common core, math, STEM, teaching, teaching tips
- Comments Off on Supporting Common Core Math Standards with Images
Math is an inherently visual subject. Would you ask a first grade student to describe the properties of a triangle, but not allow her to draw one? Test a geometry student’s understanding of the relationship between parallel lines and transversals, but provide no visual model for the question? Ask an algebra student to solve a quadratic equation, but never have him plot one on a graph? Math questions with graphics allow students to comprehend mathematical concepts more quickly and more completely than those without images.
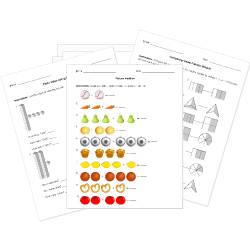
Help Teaching maintains a database of hundreds of graphics that directly support Common Core math standards. So whether you are introducing kindergartners to counting or high school students to the Law of Sines, here are some suggestions on how to incorporate images into your standards aligned math questions or worksheets.
 |
Visual Fraction Models support a range of grade one to six standards in the Geometry, Numbers & Operations – Fractions, and Number System domains. Students can develop an understanding of equal shares and fraction equivalence by comparing shaded models while older students can use models to hone critical thinking skills by solving real world problems. |
 |
Base Ten Blocks provide a visual representation of place value and support Number & Operations in Base Ten domain standards for kindergarten through grade five. Base ten blocks can be used to represent ones, tens, hundreds, and thousands and build up to illustrating multi-digit arithmetic. Combine blocks with pictographs and their use can be extended to include Counting & Cardinality standards by having students use them to learn number names and count sequences. |
 |
Grids and Graphs are mathematical staples when it comes to problem solving, so it comes as no surprise that the coordinate plane is mentioned across domains for middle and high school Common Core standards. For example, fifth graders can use Cartesian planes to learn to graph and locate coordinate pairs, directly supporting geometry standards while high school algebra students are expected to create and graph equations in two or more variables. |
 |
Circle and Polygon diagrams effectively illustrate geometry concepts across all grade levels. Beginning with learning to name and identify attributes of shapes in kindergarten to understanding circle terminology in high-school geometry, the inclusion of shape graphics in geometry questions is essential to improving student comprehension of Common Core standards. |
 |
Angle images directly support a wide range of geometry standards. Elementary students are expected to draw, recognize, and classify angles, while middle school students extend and apply this knowledge to describe geometric figures based upon their properties and solve multi-step problems to determine the measurement of an unknown angle. At the high school level, geometry students benefit from graphics to prove theorems like vertical angles are congruent. |
These are just a few examples of the Help Teaching images available that support Common Core math standards. View our complete selection of images or browse our collection of questions featuring graphics. Have suggestions for new math additions? Post your comments below or send us a note.
Read “How to Write Higher-Order Math Questions” and “How to Use Questions with Images” for more tips on creating quality, standards aligned math content.
Announcing a partnership with StudyLock™ App
- 10 October //
- Posted in Announcements //
- Tags :
- Comments Off on Announcing a partnership with StudyLock™ App
![]()
We are excited to announce Help Teaching’s partnership with StudyLock™, a parental control app. Help Teaching is an exclusive content provider for this innovative application that “parents love and teens hate”.
Eric Vreeken, the app’s creator, designed the app after having trouble prying his own children away from their devices and getting them to focus on their homework first.
The idea is that kids and tens must answer questions before they can use their devices. Help Teaching’s role is to provide the content for those multiple-choice questions, ensuring questions are available to cover multiple grade-levels and subject areas.
How does StudyLock™ Work?
StudyLock™ locks games, internet, cellphone use, smartphone applications, and texting to other telephone numbers, except for predetermined emergency phone numbers. In order for a child to unlock the device, they must answer questions in subjects such as Math, Science, History, and Literature. Parents control how many questions must be answered before the device can be used normally. Some kids may just need to answer a single question for a quick review, while others may need to answer more to encourage them to focus more on their studies and less on texting and playing with apps. Once the questions have been answered the cellphone or device can be used as normal.
The questions kids and teens must answer to unlock their devices are all provided by Help Teaching’s content contributors. Our contributors have over 20 years of combined teaching experience and are committed to providing the highest quality of content for use by StudyLock™. It’s the same high-quality content you’ll find as part of Help Teaching’s premium printable worksheets and questions. All math and language arts questions are aligned to the Common Core State Standards too, ensuring that the content is focused on the knowledge and skills kids need to know.
Of course, there’s more to StudyLock™ than just answering questions. Parents can choose to have progress reports e-mailed to them and quickly see which standards their kids and teens need the most help with. Once parents determine where their kids need the most help, they can head over to Help Teaching to discover more resources to help them improve their skills.
Using Maps as a Learning Tool
- 4 October //
- Posted in How To //
- Tags : social studies, teaching, teaching tips
- Comments Off on Using Maps as a Learning Tool
 Maps are ubiquitous in the social studies classroom, but they aren’t always used to their full capabilities. Social Studies teachers often fall into the trap of simply using maps when it’s obvious, failing to remember how maps can be used for a variety of skill building assignments and to meet various common core standards. Maps can be used to improve so many academic areas that they can be used almost every day to improve a host of skills. Some examples of the benefits of maps are:
 |
A map of the Silk Road can lead to a research assignment that uses graphic organizers. This allows the students to see how a map is a vessel for information, while allowing them to take ownership of that information by researching the parts they find most interesting. |
 |
A map showing the spread of the Black Death can help children improve their reading comprehension by properly using the symbols in the key, or it can be a used for chronological tracing of the path of the disease. Either way, the students see that a map is not just a collection of cities; a map tells a variety of stories within the confines of small area. |
 |
A map of Latin America can help students understand where countries are by placing visual representation of the places they learn about. This may be the most common use of a map, but it’s still very effective in showing students where the events that they learn about every year take place. |
 |
A map of the Greek city-states can illustrate the impact of geography on history, a central theme of state assessments and standardized tests throughout the country. Maps that ask students to infer the effects of what they see on a map help to sharpen those skills and improve their critical thinking. |
 |
A map of the Atlantic Ocean and the surrounding continents allow students to be active learners by asking them to show how this region was part of history. Ask them to trace the routes of the Atlantic Slave Trade themselves. History comes alive anytime kids are doing and not just listening or watching. |
Whether you use them for a homework assignment or entry into a deeper analysis of the great historical questions of our time, maps can do more for your lessons than you may be giving them credit for. The suggestions above touch upon the skills of analysis, reading comprehension, inference, compare and contrast, and many others.
By using a few words and a picture, a map can say so much more than text. By my count, maps can be used to meet five of the ten ELA Common Core Anchor Standards used to measure college and career readiness. Whether through their use in document based essay writing, compare and contrast activities, or as a summary of a historical event, maps can play the skill building role of a primary source reading passage.
Help Teaching has a full complement of historical and geographic maps to improve your lessons, projects, and assessments. You can create your own versions of the activities linked above that include your personal style of teaching. Few other websites have such a varied selection of maps to include in your lessons. There are also plenty of questions paired with maps that you can add to your tests and activities.
Got feedback for our maps or suggestions for new additions? Post your comments below or send us a note. Help us spread the word about our maps and printables by pinning our pages to Pinterest, liking on Facebook, and adding to your bookmarks.