


Acceleration
Acceleration
This lesson aligns with Next Generation Science Standards (NGSS) PS2.A
Introduction
An object is said to be accelerated if it speeds up or slows down. The body moving in a circle is also accelerated even if the speed is constant because the direction continuously changes. Rowing a boat, pedaling a bicycle, the moon orbiting around the earth, or when a vehicle stops at the traffic signal, all are examples of acceleration. With the help of these examples, it is easy to understand that any change in the direction of moving objects or increasing or decreasing its speed is responsible for the acceleration. Thus, acceleration refers to increasing speed, decreasing speed, or changing direction. In this article, we will learn about acceleration, types of acceleration, and velocity-time graph.
Acceleration Acceleration refers to the rate of change of velocity of an object corresponding to time. Like velocity, acceleration is also a vector quantity as it has both magnitude and direction. The S.I. unit of acceleration is ms2 or ms-2. If velocity is measured in km/h then acceleration is also measured in km/h. Acceleration can occur in the following three ways;
Increasing Speed
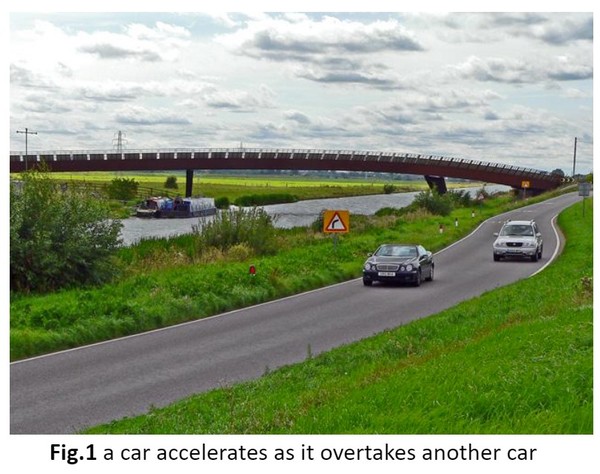
Whenever the speed of an object increases, it accelerates the object. it is also known as positive acceleration. For example, a car starts from a standstill and travels in a straight line. The driver of the car steps on the accelerator as he overtakes another car. He is increasing speed. Hence, the car is accelerated. Other examples include a ball accelerating when a bowler throws it and when a bat hits it.!
Decreasing Speed
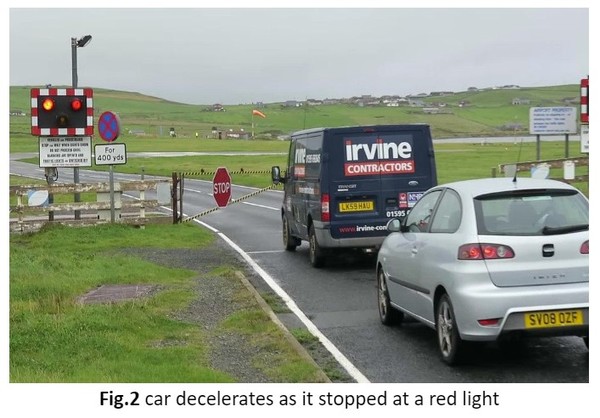
As far as speed is concerned, if objects can speed up, they can slow down as well. This decrease in speed is called deceleration or negative acceleration. For instance, a car decelerates when a driver applies brake as he stops at the red light.
Changing Direction
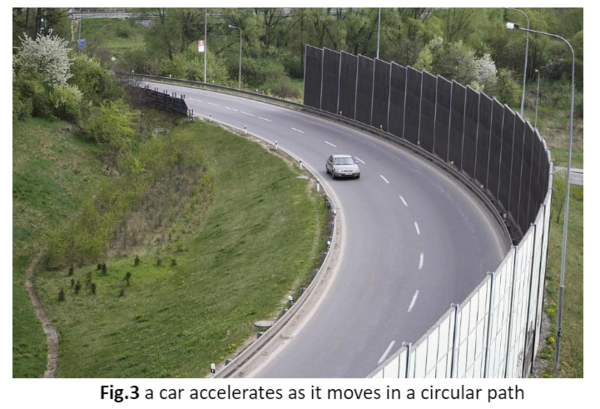
Acceleration can also occur due to a change in direction. Thus, an athlete accelerates as he follows the curve track. Many objects can change their direction without changing speed. The most common example is a smooth circular motion. a car moving in a circular path accelerates even if the speed is constant because the direction is continuously changing.
Calculating Acceleration
If a body is not changing its direction, then acceleration can be described as the rate of change of velocity. To determine the acceleration of a moving object, calculate the ratio of change in velocity to unit time. The following formula is used for calculating acceleration.
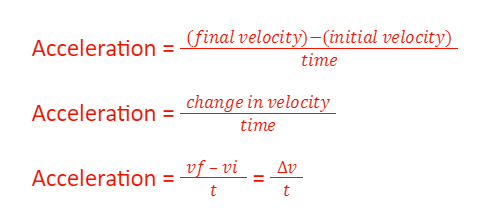
a is the acceleration (ms2)
vf is the final velocity (ms2)
vi is the initial velocity (ms2)
t is the time interval (s)
∆v is the small change in the velocity (ms2)
Types of Acceleration
Uniform AccelerationWhen an equal amount of velocity increases in equal intervals of time, then the object moves with uniform acceleration. The velocity-time graph is a straight line for a uniform acceleration. The free-fall objects represent uniform acceleration.
Non-uniform Acceleration
If the velocity of an object changes by an unequal amount in equal intervals of time, then the object moves with non-uniform acceleration. The velocity-time graph is a curved line for non-uniform acceleration. A smooth circular motion presents non-uniform acceleration.
Average Acceleration
The average acceleration refers to the total change in velocity divided by the total time taken for that change. It can be calculated by using mentioned formula.
a=∆v∆t
Instantaneous Acceleration
The acceleration of the object at a particular instant of time such that the time interval goes to zero is known as instantaneous acceleration.
Graphing Acceleration
Both the velocity-time graph and distance-time can be used to determine the motion of an accelerating object.
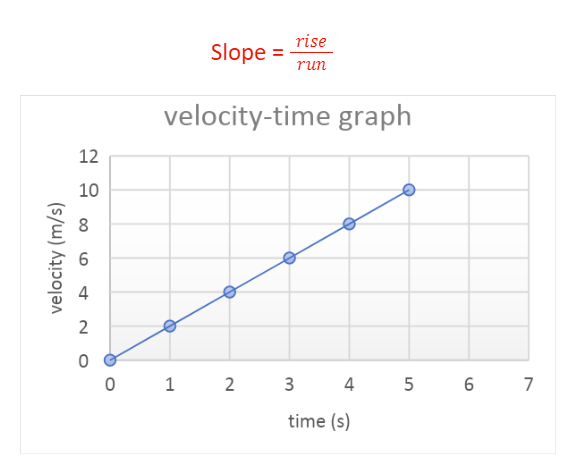
Velocity-time graph
In the velocity-time graph, velocity is plotted on the y-axis, and time is plotted on the x-axis. As shown in the figure, the velocity is increasing linearly concerning time. The straight line on the velocity-time graph shows the object is accelerating at a constant rate. This is an example of a linear graph when the object moves with constant acceleration. The slope of the graph will provide the magnitude of acceleration. To calculate the slope, choose any two points on the straight line, then divide the rise by the run.
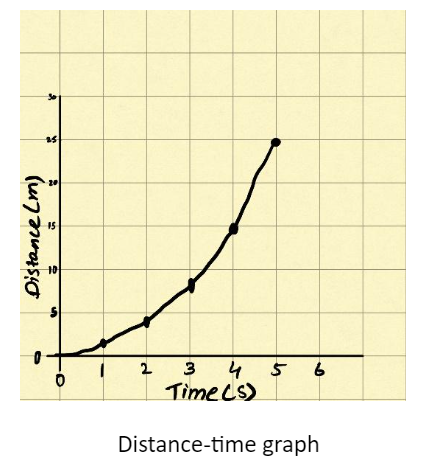
Distance-time graph
On this type of graph, distance is plotted on the y-axis, and time is plotted on the x-axis. As shown in the figure, the unequal distance is covered in equal intervals of time. The curve line on the graph means the object is accelerating. The slope of the distance-time graph represents the speed of the object. As the speed increases, the slope of the graph gets steeper and steeper.
Summary
- Acceleration is defined as the rate of change of velocity corresponding to time.
- The object is said to be accelerated if there is an increase or decrease in speed or change in the direction of motion.
- Average acceleration is the ratio of the total change in velocity to the change in time.
Related Worksheets:
Become a Help Teaching Pro subscriber to access premium lessons
Unlimited premium lessons Unlimited premium printables Unlimited online testing
- Already a Pro subscriber? Log in for access
- Browse free lessons
- Go back to previous page